The provided options in Home Assitant for displaying data is limited to some simple graphs. I wanted to have more options to display a variety of measurements and status updates.
By the end of this post, you’ll be able to use a Grafana panel in your Home Assistant dashboard. The goal is to use them via website integration.
First, you need to install the Grafana Add-on via Home Assistant. Here is the configuration which works for me. I had to turn off SSL which is fine for me since I don’t plan to access the panels from outside my network. In addition, I set up separate networks for different purposes as I described here.
env_vars:
- name: GF_AUTH_ANONYMOUS_ENABLED
value: 'true'
- name: GF_SECURITY_ALLOW_EMBEDDING
value: 'true'
- name: GF_AUTH_ANONYMOUS_ORG_NAME
value: Main Org.
- name: GF_AUTH_ANONYMOUS_ORG_ROLE
value: Viewer
- name: GF_AUTH_HIDE_VERSION
value: 'true'
keyfile: privkey.pem
plugins: []
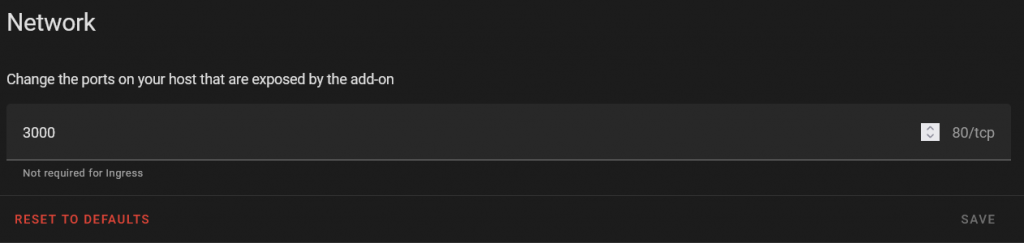
ssl: falseAnd another port needs to be configured to access Grafana via the website integration. I chose port 3000 but any available port can be used here.
Next, create an Org with the same name as in the configuration of the Add-on. in Grafana go to “Server Admin > Orgs > New Org” and type in the name. Now Grafana is ready to go.
Now you can use the Grafana panels in the Home Assistant dashboards. Click on share your panel and in the embedded panel, there is the link you need. Copy the link in the src tag, add the network port, and configure as needed. For example, remove timestamps from the link if any exist.
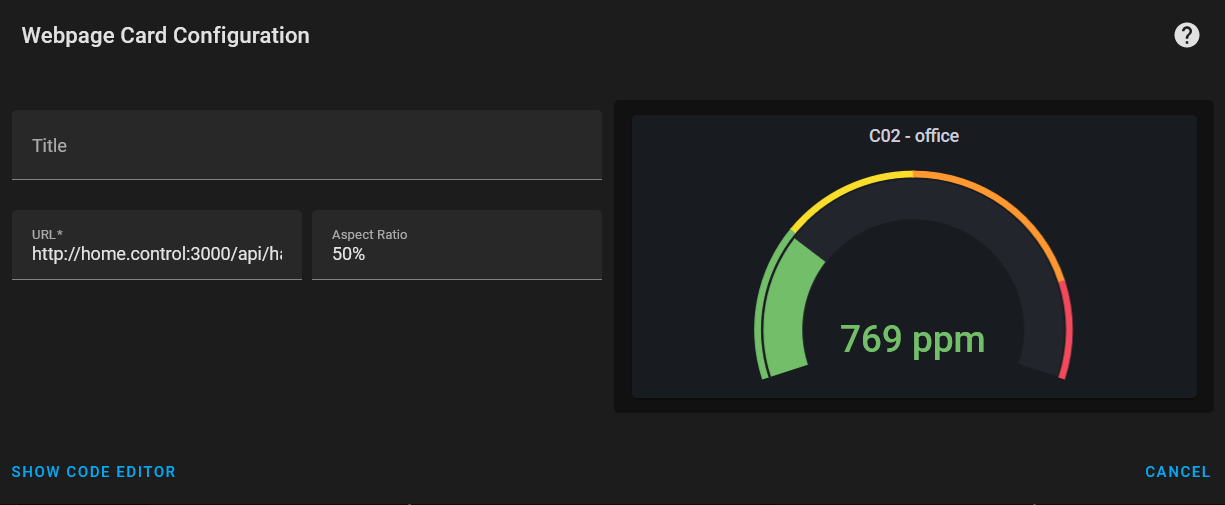
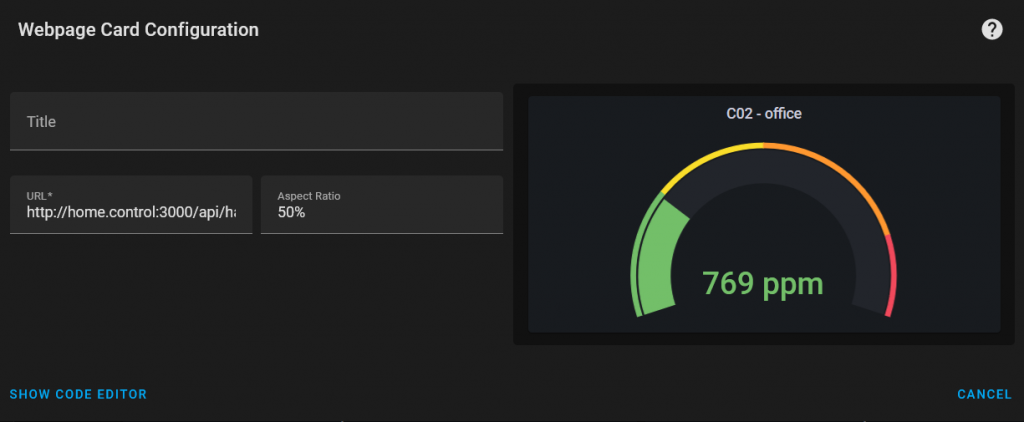
The last step is to insert the link to the dashboard. Click on “Overview > Edit Dashboard > Add Card”. Choose the webpage panel and insert the link. On the right-hand side, you should see a preview.
Conclusion
Using Grafana panels in Home Assistant dashboards gives lots of different possibilities to display data of any kind. I use these panels to display measurements from my custom air sensors as described here.